# first you should import the third-party python modules which you'll use later on
# the first line enables that figures are shown inline, directly in the notebook
%matplotlib inline
import os
from os import path
import sys
from matplotlib import pyplot as plt
import datetime as dt
import numpy as np
from shyft.time_series import Calendar
from shyft.time_series import deltahours
from shyft.time_series import TimeAxis
from shyft.time_series import point_interpretation_policy as fx_policy
from shyft.time_series import DoubleVector
from shyft.time_series import TsVector
from shyft.time_series import TimeSeries
from shyft.time_series import convolve_policy
from shyft.hydrology.orchestration import plotting as splt
# demo partition_by and percentiles function
utc = Calendar()
t0 = utc.time(2016, 9, 1)
delta = deltahours(1)
n = 7*24
ta = TimeAxis(t0, delta, n)
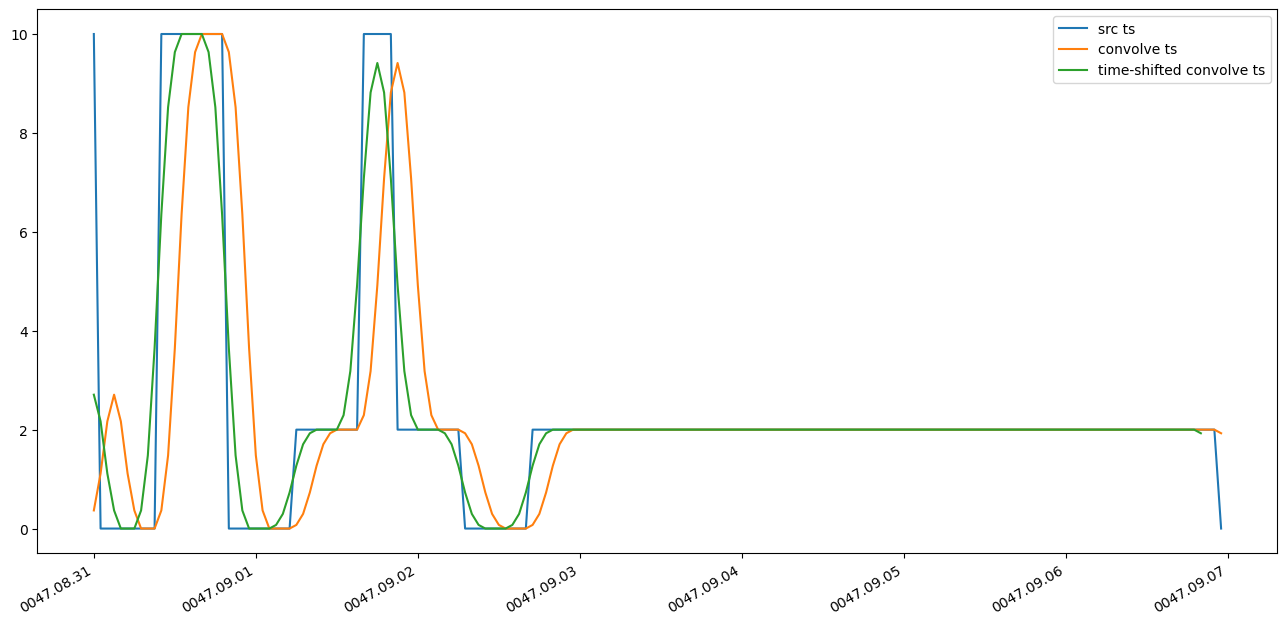
# generate a source ts, with some spikes, to demonstrate the response of the filter
ts_values = np.arange(n)
ts_values[:]=0.0
ts_values[0]=10.0
ts_values[10:20] = 10.0
ts_values[30:-1] = 2.0
ts_values[40:45] = 10.0
ts_values[55:65] = 0.2
ts = TimeSeries(ta=ta, values=DoubleVector.from_numpy(ts_values), point_fx=fx_policy.POINT_AVERAGE_VALUE)
weights = np.array([0.13533528, 0.41111229, 0.8007374 , 1. , 0.8007374 ,
0.41111229, 0.13533528]) # just a gaussian from: scipy.signal.gaussian(7, std=1.5)
weights = DoubleVector.from_numpy(weights/weights.sum()) # ensure sum of weights are 1.0
cts = ts.convolve_w(weights, convolve_policy.USE_ZERO) # in the first n-1 steps, fill in with zero
shifted_cts = cts.time_shift(deltahours(-3)).average(ta) # just time-shift,and make common time-axis
# now this is done, - we can now plot the results
common_timestamps = [dt.datetime.utcfromtimestamp(p) for p in ta.time_points][:-1]
fig, ax = plt.subplots(figsize=(16,8))
splt.set_calendar_formatter(utc)
plt.plot(common_timestamps, ts.values, label='src ts')
plt.plot(common_timestamps, cts.values, label='convolve ts')
plt.plot(common_timestamps, shifted_cts.values, label='time-shifted convolve ts')
plt.legend()