Concepts
This section contains explanations of the concepts underlying the architectural decisions and inner workings of this package.
Introduction
The dashboard module is a tool that lets you easily create visual web displays using Bokeh., centralizing methods for cleaner code and flexible design.
Since we use bokeh in many different projects common repeated methods and procedures are combined here.
This allows:
avoiding repeated code
having one way of describing App, Widget etc.
convenient refactoring
extensive re-use of code
Features:
Centralizes common methods to avoid repeated code, streamline app/widget description, ensure convenient refactoring, and promote code re-use.
Philosophy centers around treating Bokeh as a visualization engine in a model-presenter-view paradigm, aiming for eventual flexibility in replacing Bokeh with other engines.
Encourages pushing code to shyft.dashboard when beneficial for multiple projects.
Distinguishes roles: Users (app developers for projects) and Developers (shyft.dashboard developers).
In this part of the documentation the pkg architecture will be discussed along with philosophical question around it. It should serve as a starting point to further develop and use this pkg. However, these words are only the starting point and a deep dive into the code cannot be replaced by words.
In the following backend refers to shyft.dashboard.
Often the backend provides features which are not available in the bokeh pkg or buggy. Some implementations came later into bokeh while we had implemented them years earlier like the graph visualisation.
Core Philosophy
Regard Bokeh as Visualisation Engine (only)
Try to use bokeh as much as possible as view in a model-presenter-view model paradigm. I.e. we try to use bokeh as a visualisation engine only.
In this way we might be able to replace bokeh with different visualisation engines but reuse the app code. However, since we do not use a second engine and it becomes somewhat tedious to write the whole code with many interfaces it is not 100% done, yet.
Push code from projects to shyft.dashboard whenever you see a benefit for other projects
Apps from projects are the user of this project
If you are working on this pkg as a developer you are most likely also working as developer of apps for statkraft projects. See those developer roles separately, one is the user of the other
User: In the role of an project app developer
Developer: In the role of shyft.dashboard developer
By using this mindset implementation shyft.dashboard try to answer these questions:
What problem do I have as a user?
How can I as a developer of shyft.dashboard serve these problems?
How do I want to interact with shyft.dashboard as a user?
Which will result most likely in a more genuine and usable implementation.
Project structure
The project has the following folder structure:
- /apps
Contains apps which come with the backend to solve common project independent tasks
- /base
Contains the implementations of core concepts and methods like App, Widget and Port abstractions
- /entry_points
Contains entry points and console scripts to serve shyft-dashboard apps.
- /examples
Contains example apps and code for most concepts and features
- /graph
Contains widgets for expandable directed graph visualisation
- /maps
Contains widgets to visualise maps and map layers
- /test
Contains all the tests for the project. (good staring point to learn about usage of widgets etc.)
- /times_series
Contains widgets for time_series visualisation in tables and figures
- /util
Contains utility functions (some deprecated)
- /widgets
Contains useful widgets used by several user apps, often implement lacking features in bokeh
Some (core) concepts in depth
Model-View-Presenter abstraction
The purpose of using this abstraction here is:
Try to divide the data aggregation & communication from the visualisation in the browser if possible
Use interfaces for View such that a bokeh-view is only one possible option. Thus, different view-engines as e.g. plotly or grafana could be used.
This is done partly in the backend but should be forced on any new implementation and of course everything else should be refactored.
Best example:
Selector SelectorModel - SelectorPresenter - SelectorView
Gates GateModel - GatePresenter - bokeh-view (no interface for the views)
App
Defined by a collection of widgets and provides a layout <bokeh.LayoutDom> to be added to a bokeh document.
Flow of starting an App with base methods, start_bokeh_apps, make_document and MyApp with base class AppBase:
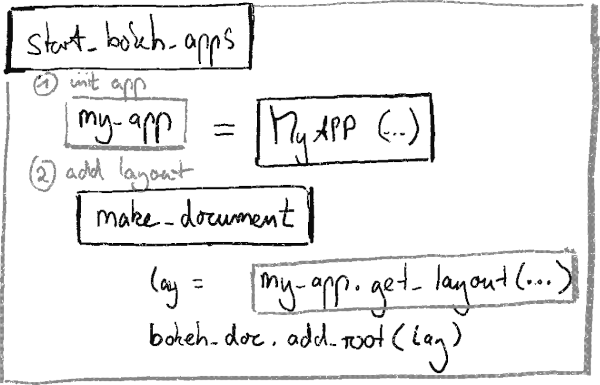
Flow of starting an app with base methods: 1. Initialisation of the app-class: my_app, 2. call the my_app.get_layout function and add it to the bokeh root document.
A Typical App.get-layout-method has 3 sections:
Initialisation of Widgets
Connection of widget ports
Definition of app layout
Entry Points
This pkg contains two console scripts, i.e after installing this pkg you can run these commands in a console regardless where you are (conda must be activated):
shyft-dashboard-examples
shyft-dashboard-visualisation
In addition an auto generated console script entry point shyft-dashboard showing the two above should be available.
Defined entry points in setup.py:
entry_points={
              'console_scripts': [
                 'examples = shyft.dashboard.entry_points.start_bokeh_examples:main',
                 'visualisation = shyft.dashboard.entry_points.visualize_apps:main'
              ],
              'shyft_dashboard_apps': [
                 'dtss_viewer_app = shyft.dashboard.apps.dtss_viewer.dtss_viewer_app:DtssViewerApp'
              ]
}
- shyft-dashboard-examples
Is used to start/serve the example apps. See shyft-dashboard-examples –help for details.
- shyft-dashboard-visualisation
This console script can be used to visualize all installed apps from different pkgs. The script collects all apps under the ‘shyft_dashboard_apps’ entry-point of all installed pkgs in the conda environment. To make your app from your pkg available follow the example above and define an ‘shyft_dashboard_apps’ entry-point . After installation you can see the app appearing in the list of available apps in shyft-dashboard-visualisation.
Widget
Component of apps with visual content with clearly defined functionality.
Mandatory properties:
Layout: provide a predefined layout optimized for widget.
layout-components: Dict with all obj composing the layout of this widget, so an app could alter the predefined layout
It is recommended to use the .layout property. NB: layout-components need either to be:
deprecated or
refactored
due to it’s limitations.
Ports
For generalisation, re-usability and plug&play purpose Widgets need to be able to communicate with each other.
This is done by sync Port connections. There are two types of Ports:
Sender [send info]
Receiver [receive info]
The signal between two ports is clear define as signal-type. Only dedicated ports with the same signal-type can be connected. Ports are connected with the connect_ports function.
Common use case: Widgets provide ports and in the app.get_layout method widgets-ports are connected.
- Connection possibilities:
a Sender can be connected to multiple Receiver
a Receiver can only be connected to 1 Sender
Class instances of Sender and Receiver ports should be named with the following pattern:
self.{send}/{receive}_{what_will_be_send_or_received}
Examples:
self.send_selections = Sender(...)
self.receive_selections = Receiver(...)
The receiver function of the Receiver port, should have the same name as it’s receiver starting with an underscore (_):
Example:
def __init__(self):
    self.receive_selections = Receiver(..., func=self._receive_selections, ...)

def _receive_selections(self, ....):
    ...
In addition to normal Ports there are so called StatePorts which can be used to send states between widgets. In this case all valid states are defined in the States Enum. The StatePorts abstraction contains both a Receiver and a Sender with the correct signal type. StatePorts can be connected to with the connect_state_ports function.
Further, Gates can be used to control the message flow between a Sender and its Receiver. The gates follow also the Model-View-Presenter abstraction.
Selectors
In the starting phase of using bokeh in statkraft, one of the most often implemented procedures where selectors. Which led very quickly in the abstraction of a simple selector to the following three abstractions: Model, Presenter and View.
This a very common abstraction and there are many good sites (google may be your friend) which explain the concept in detail. Here we highlight what these abstractions do in the Selector case:
- Model
The model contains the business logic of the selector and is implemented by the User. A base class provides the interface to it. Here it is decided what the selector options are and what to do when a selection is done.
- Presenter
The presenter serves as an intermediary between view and model. It has some helpful methods / method arguments for common tasks like sorting, triggering the callback
- View
The view is pure visualisation in the browser, e.g. a SingleSelector, RadioButtons. All views follow a common interface and do not have to be a single bokeh view, they can be combinations of bokeh widgets or even be figures with clickable patches (as done in LTM project).
Time Series Viewer
One of the main objectives in the dashboards is to show time series data. To make this task more effective and faster to implement in the different apps TsViewer evolved.
- Purpose and features
show time series data in shyft format (tsv) in figures and tables
adaptive reload of data based on Zoom stages
encapsulate bokeh complexity of Renderer, DataSources, Legends, etc.
provide async data loading
one shared time axis for several graphs and tables
ports for adding & removing DsView Handles (Data definition of what to show, where to show it
- Core components
TsViewer: Main Component, orchestration & container of everything
TimeAxisHandle: control of TimeAxis: when, what needs to be updated
ViewTimeAxis : TimeAxis of the figures connected to bokeh
ViewContainer: [Figure/Table/Legend], widgets which can show data
Source: Data loading component, loads data defined by ‘Data Source’ (1:1 mapping to all ‘DataSource’s)
- User components:
to define the data and how data should be visualized by the core components:
DataSource: User definition of what data to show
View: User definition of how and where to show data
DsViewHandle: Combination of DataSource & multiple Views