Sensitivity analysis of radiation routine
Setup environment for tutorials
The purpose of this notebook is to verify the Shyft implementation of Radiation routine.
ref.: Allen R.G., Trezza R., Tasumi, Masahiro. Analytical integrated functions for daily solar radiation on slopes. Agricultural and Forest Meteorology 139 (2006) 55–73
First we will import all necessary content
import os
import sys
import numpy as np
import math
from matplotlib import pyplot as plt
from datetime import datetime
import shyft.hydrology as api
from shyft.time_series import (Calendar,deltahours,UtcPeriod,TimeSeries,TimeAxis,DoubleVector,point_interpretation_policy)
Then some helper functions:
import shyft.hydrology as api
import shyft.time_series as sts
from matplotlib import pyplot as plt
#import seaborn as sns

class RadiationRunner():
    def __init__(self):
        self.runner= True


    def run_radiation_ta(self, ta, latitude_deg, slope_deg, aspect_deg, elevation, albedo, turbidity, temperature, rhumidity,
                    flag='instant', rsm=0.0, method='dingman'):

        """Runs radiation model based on the info coming from camels data, with 24 hours timestep """
        # single method test

        # here I will try to reproduce the Fig.1b from Allen2006 (reference)

        # converting station data
        tempP1 = temperature  # [degC], real data should be used
        rhP1 = rhumidity  # [%], real data should be used
        #     rsm = 0.0

        radparam = api.RadiationParameter(albedo, turbidity)
        radcal = api.RadiationCalculator(radparam)
        radres = api.RadiationResponse()

        rv_rso = []  # clear-sky radiation, result vector
        rv_rs = []  # translated, result vector
        rv_ra = []  # extraterrestrial radiation, result vector
        rv_net = []  # net radiation
        rv_net_sw = []  # net short-wave
        rv_net_lw = []  # net long-wave

        # running 24-h timestep
        dayi = 0
        doy = api.DoubleVector()

        # running 24-h timestep
        step = sts.deltahours(24)
        n = ta.size()
        k = 1
        while (k < n):
            time1 = ta.time(k - 1)
            if method == 'dingman':
                radcal.net_radiation_step(radres, latitude_deg, time1, step, slope_deg, aspect_deg,
                                                tempP1[k], rhP1[k], elevation, rsm[k])
            else:
                radcal.net_radiation_step_asce_st(radres, latitude_deg, time1, step, slope_deg, aspect_deg,
                                                        tempP1[k], rhP1[k], elevation, rsm[k])
            rv_rso.append(radres.sw_t)
            rv_rs.append(radres.sw_cs_p)
            rv_ra.append(radres.ra)
            rv_net.append(radres.net)
            rv_net_sw.append(radres.net_sw)
            rv_net_lw.append(radres.net_lw)
            # print(radres_24h.ra)
            doy.append(dayi)
            k += 1
            dayi += 1
            # doy.append(dayi)

        return doy, rv_ra, rv_rs, rv_rso,rv_net_sw, rv_net_lw, rv_net

    def run_radiation(self, t_start, n, latitude_deg, slope_deg, aspect_deg, elevation, albedo, turbidity, temperature, rhumidity,
                    flag='instant', rsm=0.0, method='dingman'):

        """Module creates shyft radiation model with different timesteps and run it for a defined period of time (1 year with 24-hours averaging) """
        # single method test

        # here I will try to reproduce the Fig.1b from Allen2006 (reference)

        # converting station data
        tempP1 = temperature  # [degC], real data should be used
        rhP1 = rhumidity  # [%], real data should be used
        #     rsm = 0.0

        radparam = api.RadiationParameter(albedo, turbidity)
        radcal_inst = api.RadiationCalculator(radparam)
        radcal_1h = api.RadiationCalculator(radparam)
        radcal_24h = api.RadiationCalculator(radparam)
        radcal_3h = api.RadiationCalculator(radparam)
        radres_inst = api.RadiationResponse()
        radres_1h = api.RadiationResponse()
        radres_24h = api.RadiationResponse()
        radres_3h = api.RadiationResponse()

        rv_rso = []  # clear-sky radiation, result vector
        rv_ra = []  # extraterrestrial radiation, result vector
        rv_net = []  # net radiation
        rv_net_sw = []  # net short-wave
        rv_net_lw = []  # net long-wave

        dayi = 0
        doy = api.DoubleVector()
        # running 24-h timestep
        step = sts.deltahours(24)
        tadays = sts.TimeAxis(t_start, step, n + 1)  # days
        k = 1
        while (k <= n):
            doy.append(dayi)
            k += 1
            dayi += 1

        if flag == '24-hour':
            dayi = 0
            doy = api.DoubleVector()

            # running 24-h timestep
            step = sts.deltahours(24)
            tadays = sts.TimeAxis(t_start, step, n + 1)  # days
            k = 1
            while (k <= n):
                time1 = tadays.time(k - 1)
                if method == 'dingman':
                    radcal_24h.net_radiation_step(radres_24h, latitude_deg, time1, step, slope_deg, aspect_deg,
                                                tempP1, rhP1, elevation, rsm)
                else:
                    radcal_24h.net_radiation_step_asce_st(radres_24h, latitude_deg, time1, step, slope_deg, aspect_deg,
                                                        tempP1, rhP1, elevation, rsm)
                rv_rso.append(radres_24h.sw_cs_p)
                rv_ra.append(radres_24h.ra)
                rv_net.append(radres_24h.net)
                rv_net_sw.append(radres_24h.net_sw)
                rv_net_lw.append(radres_24h.net_lw)
                # print(radres_24h.ra)
                doy.append(dayi)
                k += 1
                dayi += 1
            # doy.append(dayi)
        elif flag == '3-hour':

            # running 3h timestep
            step = sts.deltahours(3)
            ta3 = sts.TimeAxis(t_start, step, n * 8)  # hours, 1h timestep
            rso_3h = []  # clear-sky radiation
            ra_3h = []  # extraterrestrial radiation
            net_sw_3h = []
            net_lw_3h = []
            net_3h = []
            k = 1
            while (k < n * 8):
                time0 = ta3.time(k - 1)
                if method == 'dingman':
                    radcal_3h.net_radiation_step(radres_3h, latitude_deg, time0, step, slope_deg, aspect_deg, tempP1,
                                                rhP1, elevation, rsm)
                else:
                    radcal_3h.net_radiation_step_asce_st(radres_3h, latitude_deg, time0, step, slope_deg, aspect_deg,
                                                        tempP1, rhP1, elevation, rsm)
                rso_3h.append(radres_3h.sw_cs_p)
                ra_3h.append(radres_3h.ra)
                net_sw_3h.append(radres_3h.net_sw)
                net_lw_3h.append(radres_3h.net_lw)
                net_3h.append(radres_3h.net)
                k += 1
            rv_rso = [sum(rso_3h[i:i + 8]) for i in range(0, len(rso_3h), 8)]
            rv_ra = [sum(ra_3h[i:i + 8]) for i in range(0, len(ra_3h), 8)]
            rv_net_sw = [sum(net_sw_3h[i:i + 8]) for i in range(0, len(net_sw_3h), 8)]
            rv_net_lw = [sum(net_lw_3h[i:i + 8]) / 8 for i in range(0, len(net_lw_3h), 8)]
            rv_net = [sum(net_3h[i:i + 8]) for i in range(0, len(net_3h), 8)]
        elif flag == '1-hour':
            # runing 1h timestep
            step = sts.deltahours(1)
            ta = sts.TimeAxis(t_start, step, n * 24)  # hours, 1h timestep
            rso_1h = []
            ra_1h = []
            net_sw_1h = []
            net_lw_1h = []
            net_1h = []
            k = 1
            while (k < n * 24):
                time1 = ta.time(k - 1)
                if method == 'dingman':
                    radcal_1h.net_radiation_step(radres_1h, latitude_deg, time1, step, slope_deg, aspect_deg,
                                                tempP1, rhP1, elevation, rsm)
                else:
                    radcal_1h.net_radiation_step_asce_st(radres_1h, latitude_deg, time1, step, slope_deg, aspect_deg,
                                                        tempP1, rhP1, elevation, rsm)
                rso_1h.append(radres_1h.sw_cs_p)
                ra_1h.append(radres_1h.ra)
                net_sw_1h.append(radres_1h.net_sw)
                net_lw_1h.append(radres_1h.net_lw)
                net_1h.append(radres_1h.net)
                k += 1
            rv_rso = [sum(rso_1h[i:i + 24]) for i in range(0, len(rso_1h), 24)]
            rv_ra = [sum(ra_1h[i:i + 24]) for i in range(0, len(ra_1h), 24)]
            rv_net_sw = [sum(net_sw_1h[i:i + 24]) for i in range(0, len(net_sw_1h), 24)]
            rv_net_lw = [sum(net_lw_1h[i:i + 24]) / 24 for i in range(0, len(net_lw_1h), 24)]
            rv_net = [sum(net_1h[i:i + 24]) for i in range(0, len(net_1h), 24)]
        elif flag == 'instant':
            # running instantaneous with dmin timstep
            minutes = 60
            dmin = 1
            step = sts.deltaminutes(dmin)
            tamin = sts.TimeAxis(t_start, step, n * 24 * minutes)
            rso_inst = []
            ra_inst = []
            net_sw_inst = []
            net_lw_inst = []
            net_inst = []
            doy1 = []
            k = 0
            while (k < n * 24 * minutes):
                timemin = tamin.time(k)
                radcal_inst.net_radiation_inst(radres_inst, latitude_deg, timemin, slope_deg, aspect_deg, tempP1, rhP1,
                                        elevation, rsm)
                rso_inst.append(radres_inst.sw_cs_p)
                ra_inst.append(radres_inst.ra)
                net_sw_inst.append(radres_inst.net_sw)
                net_lw_inst.append(radres_inst.net_lw)
                net_inst.append(radres_inst.net)
                doy1.append(k)
                k += 1
            rv_rso = [sum(rso_inst[i:i + 24 * minutes]) / (24 * minutes) for i in range(0, len(rso_inst), 24 * minutes)]
            rv_ra = [sum(ra_inst[i:i + 24 * minutes]) / (24 * minutes) for i in range(0, len(ra_inst), 24 * minutes)]
            rv_net_sw = [sum(net_sw_inst[i:i + 24 * minutes]) / (24 * minutes) for i in
                        range(0, len(net_sw_inst), 24 * minutes)]
            rv_net_lw = [sum(net_lw_inst[i:i + 24 * minutes]) / (24 * minutes) for i in
                        range(0, len(net_lw_inst), 24 * minutes)]
            rv_net = [sum(net_inst[i:i + 24 * minutes]) / (24 * minutes) for i in range(0, len(net_inst), 24 * minutes)]
        else:
            return 'Nothing todo. Please, specify timestep'

        return doy, rv_ra, rv_rso, rv_net_sw, rv_net_lw, rv_net

def plot_results(xvar, yvar, fig1, ax1, ymax, xname, yname, plotname, lab, col, labloc, ymin=0.0):
    """ Plots things"""
    ax1.plot(xvar, yvar, col, label=lab)
    ax1.set_ylabel(yname)
    ax1.set_xlabel(xname)
    plt.title(plotname)
    plt.legend(loc=labloc)
    plt.axis([0, 365, ymin, int(ymax * 1.01)])
    plt.grid(True)
runner = RadiationRunner()
Information about station
latitude_deg = 44.0
slope_deg = 0.0
aspect_deg = 0.0
orient=" South. "
if aspect_deg>=180:
    orient=" North. "
albedo = 0.05
turbidity = 1.0
elevation = 150.0
temperature = 20.0 # [degC], real data should be used
rhumidity = 50.0 #[%], real data should be used
gsc = 1367

utc = Calendar()
n = 365  # nr of time steps: 1 year, daily data
t_start = utc.time(2002, 1, 1)  # starting at the beginning of the year 1970
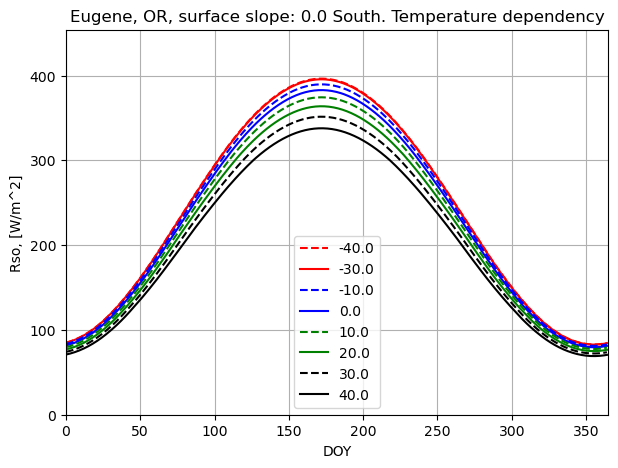
Temperature dependency
ymax = 450
yname = 'Rso, [W/m^2]'
xname = 'DOY'
plotname = "Eugene, OR, surface slope: "+str(slope_deg)+orient+ "Temperature dependency"
labels = ('Ra','Rso')
colors = ('r--','r', 'b--','b','g--','g','k--','k')
labloc = ("upper left","lower center", "upper center")

#sns.set(font_scale=1.8)
fig1, ax1 = plt.subplots(figsize=(7, 5))

temperature_array = [-40.0, -30.0, -10.0, 0.0, 10.0, 20.0, 30.0, 40.0]
i=0
for temperature in temperature_array:
    result = runner.run_radiation(t_start,n,latitude_deg, slope_deg, aspect_deg, elevation, albedo, turbidity, temperature, rhumidity, '1-hour')
    #print(result[2])
    plot_results(result[0], result[2], fig1, ax1, ymax, xname, yname, plotname, str(temperature), colors[i],labloc[1])
    i+=1
plt.show()
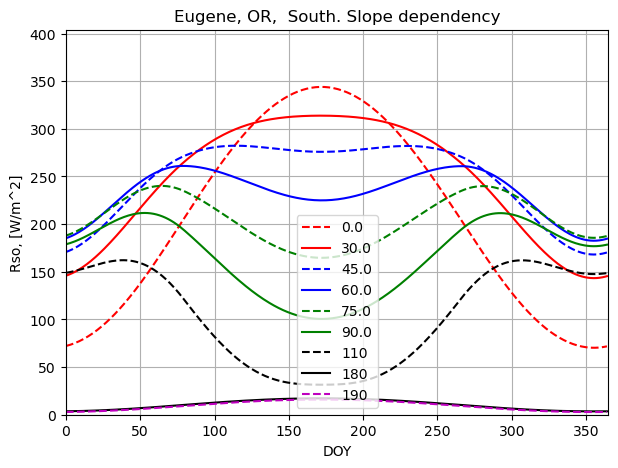
Slope dependency
slope_array = [0.0, 30.0, 45.0, 60.0, 75.0, 90.0, 110, 180, 190]
ymax = 400
yname = 'Rso, [W/m^2]'
xname = 'DOY'
plotname = "Eugene, OR, "+orient+ "Slope dependency"
labels = ('Ra','Rso')
colors = ('r--','r', 'b--','b','g--','g','k--','k', 'm--', 'm')
labloc = ("upper left","lower center", "upper center")

fig1, ax1 = plt.subplots(figsize=(7, 5))
i = 0
for slope in slope_array:
    result = runner.run_radiation(t_start,n,latitude_deg, slope, aspect_deg, elevation, albedo, turbidity, temperature, rhumidity,'24-hour')
    # plot_results.plot_results(result[0], result[1], fig1, ax1, ymax, xname, yname, plotname, labels[0], colors[0])  # 1h
    plot_results(result[0], result[2], fig1, ax1, ymax, xname, yname, plotname, str(slope), colors[i],labloc[1]) # 1h
    # colors = ('b--','b')
    # plot_results.plot_results(result[0],result[3],result[4], fig1, ax1, ymax, xname, yname, plotname, labels, colors[i]) # 3h
    # colors = ('k--','k')
    # plot_results.plot_results(result[0],result[5],result[6], fig1, ax1, ymax, xname, yname, plotname, labels, colors[i]) # 24h
    i+=1
plt.show()
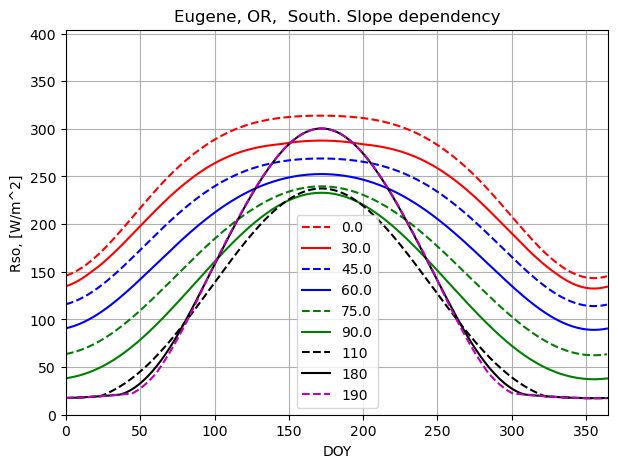
Aspect dependency
aspect_array = [0.0, 30.0, 45.0, 60.0, 75.0, 90.0, 110, 180, 190]
slope = 30.0 # aspect is only affected when slope not zero ))
ymax = 400
yname = 'Rso, [W/m^2]'
xname = 'DOY'
plotname = "Eugene, OR, "+orient+ "Slope dependency"
labels = ('Ra','Rso')
colors = ('r--','r', 'b--','b','g--','g','k--','k', 'm--', 'm')
labloc = ("upper left","lower center", "upper center")

fig1, ax1 = plt.subplots(figsize=(7, 5))
i = 0
for aspect in aspect_array:
    result = runner.run_radiation(t_start,n,latitude_deg, slope, aspect, elevation, albedo, turbidity, temperature, rhumidity,'24-hour')
    # plot_results.plot_results(result[0], result[1], fig1, ax1, ymax, xname, yname, plotname, labels[0], colors[0])  # 1h
    plot_results(result[0], result[2], fig1, ax1, ymax, xname, yname, plotname, str(aspect), colors[i],labloc[1]) # 1h
    # colors = ('b--','b')
    # plot_results.plot_results(result[0],result[3],result[4], fig1, ax1, ymax, xname, yname, plotname, labels, colors[i]) # 3h
    # colors = ('k--','k')
    # plot_results.plot_results(result[0],result[5],result[6], fig1, ax1, ymax, xname, yname, plotname, labels, colors[i]) # 24h
    i+=1
plt.show()
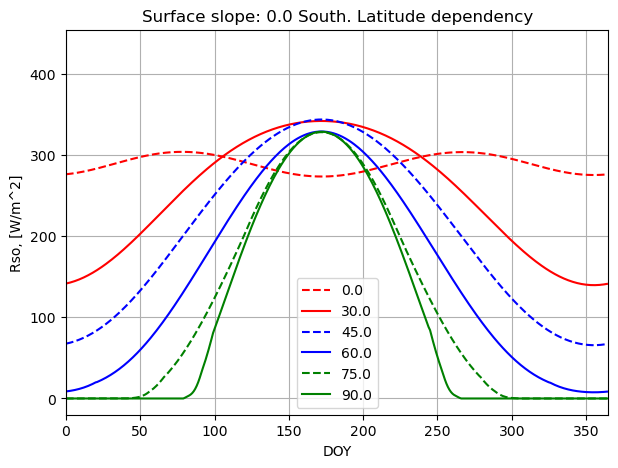
Latitude dependency
lat_array = [0.0, 30.0, 45.0, 60.0, 75.0, 90.0]
slope_deg = 0.0
aspect_deg = 60.0
ymax = 450
ymin = -20
yname = 'Rso, [W/m^2]'
xname = 'DOY'
plotname = "Surface slope: "+str(slope_deg)+orient+ "Latitude dependency"
labels = ('Ra','Rso')
colors = ('r--','r', 'b--','b','g--','g','k--','k','m--','m','y--','y')
labloc = ("upper left","lower center", "upper center")

fig1, ax1 = plt.subplots(figsize=(7, 5))
i = 0
for lat in lat_array:
    result = runner.run_radiation(t_start,n,lat, slope_deg, aspect_deg, elevation, albedo, turbidity, temperature, rhumidity,'24-hour')
    # plot_results.plot_results(result[0], result[1], fig1, ax1, ymax, xname, yname, plotname, labels[0], colors[0])  # 1h
    plot_results(result[0], result[2], fig1, ax1, ymax, xname, yname, plotname, str(lat), colors[i],labloc[1],ymin) # 1h
    # colors = ('b--','b')
    # plot_results.plot_results(result[0],result[3],result[4], fig1, ax1, ymax, xname, yname, plotname, labels, colors[i]) # 3h
    # colors = ('k--','k')
    # plot_results.plot_results(result[0],result[5],result[6], fig1, ax1, ymax, xname, yname, plotname, labels, colors[i]) # 24h
    i+=1
plt.show()
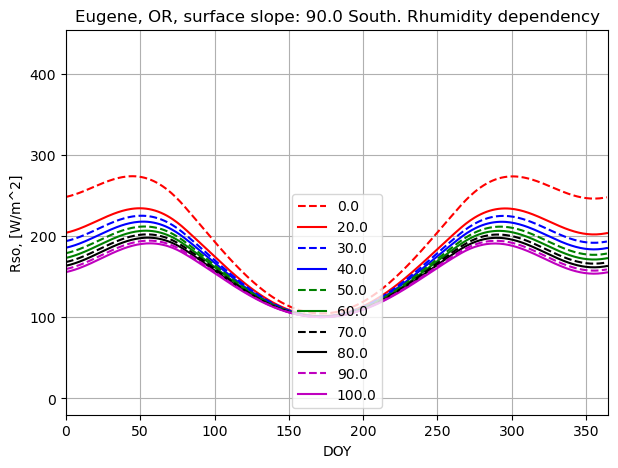
RHumidity dependency
rhumidity_array = [0.0, 20.0, 30.0, 40.0,50.0, 60.0, 70.0,80.0, 90.0, 100.0]
slope_deg = 90.0
aspect_deg = 0.0
ymax = 450
ymin = -20
yname = 'Rso, [W/m^2]'
xname = 'DOY'
plotname = "Eugene, OR, surface slope: "+str(slope_deg)+orient+ "Rhumidity dependency"
labels = ('Ra','Rso')
colors = ('r--','r', 'b--','b','g--','g','k--','k','m--','m','y--','y')
labloc = ("upper left","lower center", "upper center","lower left")

fig1, ax1 = plt.subplots(figsize=(7, 5))
i = 0
for rhum in rhumidity_array:
    result = runner.run_radiation(t_start,n,latitude_deg, slope_deg, aspect_deg, elevation, albedo, turbidity, temperature, rhum, '24-hour')
    # plot_results.plot_results(result[0], result[1], fig1, ax1, ymax, xname, yname, plotname, labels[0], colors[0])  # 1h
    plot_results(result[0], result[2], fig1, ax1, ymax, xname, yname, plotname, str(rhum), colors[i],labloc[1],ymin) # 1h
    # colors = ('b--','b')
    # plot_results.plot_results(result[0],result[3],result[4], fig1, ax1, ymax, xname, yname, plotname, labels, colors[i]) # 3h
    # colors = ('k--','k')
    # plot_results.plot_results(result[0],result[5],result[6], fig1, ax1, ymax, xname, yname, plotname, labels, colors[i]) # 24h
    i+=1
plt.show()
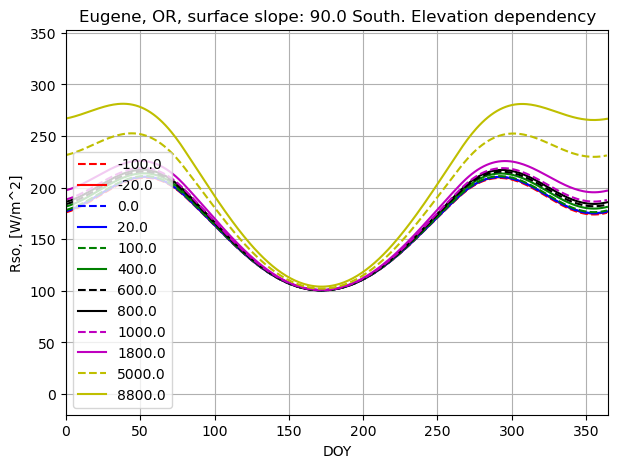
Elevation dependency
elevation_array = [-100.0, -20.0,0.0, 20.0, 100.0,400.0, 600.0, 800.0, 1000.0, 1800.0, 5000.0, 8800.0]
slope_deg = 90.0
ymax = 350
ymin = -20
yname = 'Rso, [W/m^2]'
xname = 'DOY'
plotname = "Eugene, OR, surface slope: "+str(slope_deg)+orient+ "Elevation dependency"
labels = ('Ra','Rso')
colors = ('r--','r', 'b--','b','g--','g','k--','k','m--','m','y--','y')
labloc = ("upper left","lower center", "upper center","lower left")

fig1, ax1 = plt.subplots(figsize=(7, 5))
i = 0
for elev in elevation_array:
    result = runner.run_radiation(t_start,n,latitude_deg, slope_deg, aspect_deg, elev, albedo, turbidity, temperature, rhumidity, '24-hour')
    # plot_results.plot_results(result[0], result[1], fig1, ax1, ymax, xname, yname, plotname, labels[0], colors[0])  # 1h
    plot_results(result[0], result[2], fig1, ax1, ymax, xname, yname, plotname, str(elev), colors[i],labloc[3],ymin) # 1h
    # colors = ('b--','b')
    # plot_results.plot_results(result[0],result[3],result[4], fig1, ax1, ymax, xname, yname, plotname, labels, colors[i]) # 3h
    # colors = ('k--','k')
    # plot_results.plot_results(result[0],result[5],result[6], fig1, ax1, ymax, xname, yname, plotname, labels, colors[i]) # 24h
    i+=1
plt.show()
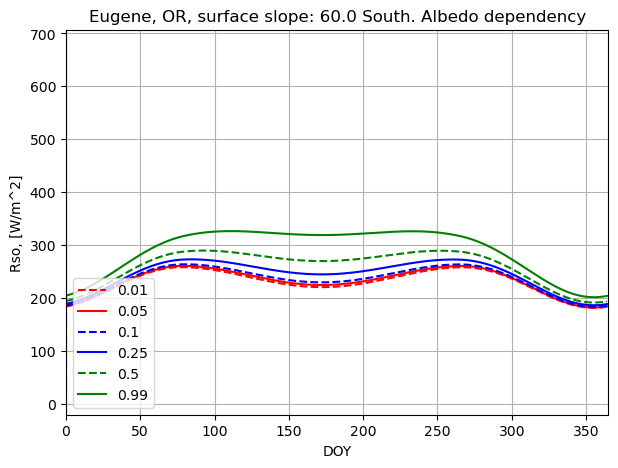
Albedo dependency
albedo_array = [0.01, 0.05, 0.1, 0.25, 0.5, 0.99]
slope_deg = 60.0
ymax = 700
ymin = -20
yname = 'Rso, [W/m^2]'
xname = 'DOY'
plotname = "Eugene, OR, surface slope: "+str(slope_deg)+orient+ "Albedo dependency"
labels = ('Ra','Rso')
colors = ('r--','r', 'b--','b','g--','g','k--','k','m--','m','y--','y')
labloc = ("upper left","lower center", "upper center","lower left")

fig1, ax1 = plt.subplots(figsize=(7, 5))
i = 0
for albedo in albedo_array:
    result = runner.run_radiation(t_start,n,latitude_deg, slope_deg, aspect_deg, elevation, albedo, turbidity, temperature, rhumidity,'24-hour')
    plot_results(result[0], result[2], fig1, ax1, ymax, xname, yname, plotname, str(albedo), colors[i],labloc[3],ymin) # 1h
    i+=1
plt.show()
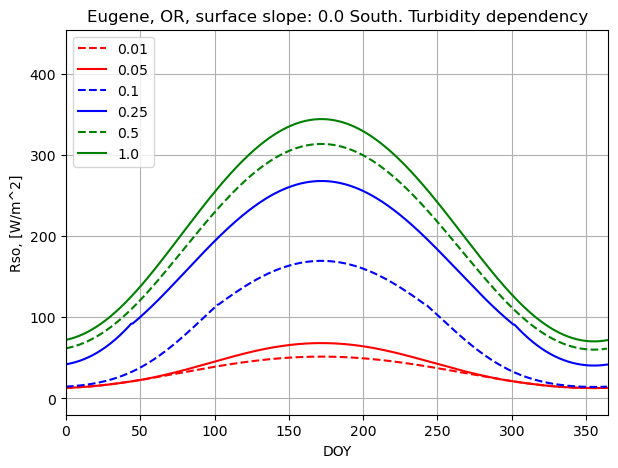
Turbidity dependency
turbidity_array = [0.01, 0.05, 0.1, 0.25, 0.5, 1.0]
slope_deg = 0.0
ymax = 450
ymin = -20
yname = 'Rso, [W/m^2]'
xname = 'DOY'
plotname = "Eugene, OR, surface slope: "+str(slope_deg)+orient+ "Turbidity dependency"
labels = ('Ra','Rso')
colors = ('r--','r', 'b--','b','g--','g','k--','k','m--','m','y--','y')
labloc = ("upper left","lower center", "upper center","lower left")

fig1, ax1 = plt.subplots(figsize=(7, 5))
i = 0
for turbidity in turbidity_array:
    result = runner.run_radiation(t_start,n,latitude_deg, slope_deg, aspect_deg, elevation, albedo, turbidity, temperature, rhumidity, '24-hour')
    # plot_results.plot_results(result[0], result[1], fig1, ax1, ymax, xname, yname, plotname, labels[0], colors[0])  # 1h
    plot_results(result[0], result[2], fig1, ax1, ymax, xname, yname, plotname, str(turbidity), colors[i],labloc[0],ymin) # 1h
    # colors = ('b--','b')
    # plot_results.plot_results(result[0],result[3],result[4], fig1, ax1, ymax, xname, yname, plotname, labels, colors[i]) # 3h
    # colors = ('k--','k')
    # plot_results.plot_results(result[0],result[5],result[6], fig1, ax1, ymax, xname, yname, plotname, labels, colors[i]) # 24h
    i+=1
plt.show()
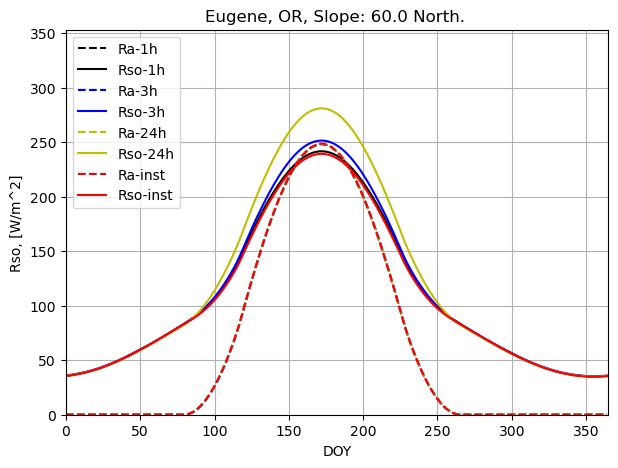
Time-step verification of algorithm
# slope_array = [0.0, 10.0, 30.0, 45.0, 60.0,75.0, 90.0]
slope_array = [60.0]
slope_deg = 60.0
aspect_deg = 180.0
orient=" South. "
if aspect_deg>=180:
    orient=" North. "
ymax = 350
yname = 'Rso, [W/m^2]'
xname = 'DOY'
plotname = "Eugene, OR, "+"Slope: " + str(slope_deg) + orient
labels = ('Ra','Rso')

colors1 = ('r--','k--','b--', 'y--','g--')
colors = ('r','k','b','y','g')
labloc = ("upper left","lower center","upper left", "lower center", "upper center")

fig1, ax1 = plt.subplots(figsize=(7, 5))
i = 0
for slope in slope_array:
    result = runner.run_radiation(t_start,n,latitude_deg, slope, aspect_deg, elevation, albedo, turbidity, temperature,rhumidity, '1-hour')
    plot_results(result[0], result[1], fig1, ax1, ymax, xname, yname, plotname, 'Ra-1h', colors1[1],labloc[2])
    plot_results(result[0], result[2], fig1, ax1, ymax, xname, yname, plotname, 'Rso-1h', colors[1],labloc[2])
    result = runner.run_radiation(t_start,n,latitude_deg, slope, aspect_deg, elevation, albedo, turbidity, temperature,
                                        rhumidity, '3-hour')
    plot_results(result[0], result[1], fig1, ax1, ymax, xname, yname, plotname, 'Ra-3h', colors1[2],
                            labloc[2])
    plot_results(result[0], result[2], fig1, ax1, ymax, xname, yname, plotname, 'Rso-3h', colors[2],
                            labloc[2])
    result = runner.run_radiation(t_start,n,latitude_deg, slope, aspect_deg, elevation, albedo, turbidity, temperature,
                                        rhumidity, '24-hour')
    plot_results(result[0], result[1], fig1, ax1, ymax, xname, yname, plotname, 'Ra-24h', colors1[3],
                            labloc[2])
    plot_results(result[0], result[2], fig1, ax1, ymax, xname, yname, plotname, 'Rso-24h', colors[3],
                            labloc[2])
    result = runner.run_radiation(t_start,n,latitude_deg, slope, aspect_deg, elevation, albedo, turbidity, temperature,
                                        rhumidity, 'instant')
    plot_results(result[0], result[1], fig1, ax1, ymax, xname, yname, plotname, 'Ra-inst', colors1[0],
                            labloc[2])
    plot_results(result[0], result[2], fig1, ax1, ymax, xname, yname, plotname, 'Rso-inst', colors[0],
                            labloc[2])
    i+=1
plt.show()
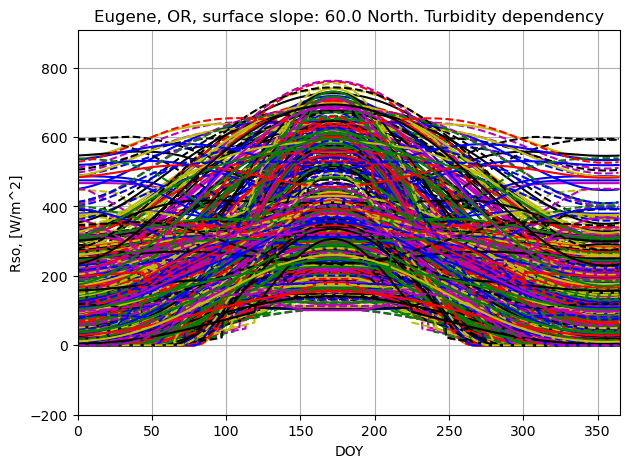
Random inputs
import random

number_of_trials = 1000


ymax = 900
ymin = -200
yname = 'Rso, [W/m^2]'
xname = 'DOY'
plotname = "Eugene, OR, surface slope: "+str(slope_deg)+orient+ "Turbidity dependency"
labels = ('Ra','Rso')
colors = ('r--','r', 'b--','b','g--','g','k--','k','m--','m','y--','y')
labloc = ("upper left","lower center", "upper center","lower left")

fig1, ax1 = plt.subplots(figsize=(7, 5))
i = 0
for c in range(1,number_of_trials):
    slope_deg = random.uniform(0.0,360.0)
    aspect_deg = random. uniform(0.0,360.0)
    latitude_deg = random.uniform(0.0,90.0)
    elevation = random.uniform(0.0,8800.0)
    rsm = random.uniform(0.0,1367.0)
    color_id = random.randint(0,11)
    result = runner.run_radiation(t_start,n,latitude_deg, slope_deg, aspect_deg, elevation, albedo, turbidity, temperature, rhumidity, '24-hour', )
    ax1.plot(result[0], result[2], colors[color_id])
    ax1.set_ylabel(yname)
    ax1.set_xlabel(xname)
    plt.title(plotname)
    plt.axis([0, 365, ymin, int(ymax*1.01)])
    plt.grid(True)
    i+=1
plt.show()