Radiation algorithm on the camels data
Setup environment for tutorials
The main goal is to demonstrate sensitivity of eq.38 from
ref.: Allen R.G., Trezza R., Tasumi, Masahiro. Analytical integrated functions for daily solar radiation on slopes. Agricultural and Forest Meteorology 139 (2006) 55–73
Importing all necessary classes
from matplotlib import pyplot as plt
from datetime import datetime
import shyft.hydrology as api
import shyft.time_series as sts
#import seaborn as sns
import numpy as np
import numpy as np
import pandas as pd

import shyft.hydrology as api
import shyft.time_series as sts

test_data_dir = "/workspaces/shyft-doc/sphinx/notebooks/radiation/test_data/"

class TestData():
    def __init__(self):
        self.met_filename = test_data_dir + "06191500_lump_cida_forcing_leap.txt"
        self.streamflow_filename = test_data_dir + "06191500_streamflow_qc.txt"
        self._station_info, self._df_met = self._get_met_data_from_camels_database()
        self._df_streamflow = self._get_streamflow_data_from_camels_database()
        self.temperature = self._df_met['temperature'].values
        self.precipitation = self._df_met['precipitation'].values
        self.radiation = self._df_met['radiation'].values
        self.relative_humidity = self._df_met['relative_humidity'].values
        self.wind_speed = self._df_met['wind_speed'].values
        self.time = self._df_met['time'].values
        self.discharge = self._df_streamflow.discharge
        self.area = self._station_info['area']
        # TODO assure time is same; assure same length of all;


    def _get_met_data_from_camels_database(self):
        station_info = {}
        with open(self.met_filename) as data:
            station_info['lat'] = float(data.readline())  # latitude of gauge
            station_info['z'] = float(data.readline())  # elevation of gauge (m)
            station_info['area'] = float(data.readline())  # area of basin (m^2)
        keys = ['Date', 'dayl', 'precipitation', 'radiation', 'swe', 'tmax', 'tmin', 'vp']
        df = pd.read_table(self.met_filename, skiprows=4, names=keys)
        df["temperature"] = (df["tmin"] + df["tmax"]) / 2.
        df.pop("tmin")
        df.pop("tmax")
        df["precipitation"] = df["precipitation"] / 24.0 # mm/h
        df["wind_speed"] = df["temperature"] * 0.0 + 2.0  # no wind speed in camels
        df["relative_humidity"] = df["temperature"] * 0.0 + 0.7  # no relative humidity in camels
        df["time"] = self._get_utc_time_from_daily_camels_met(df['Date'].values)
        return station_info, df

    def _get_streamflow_data_from_camels_database(self):
        keys = ['sgid','Year','Month', 'Day', 'discharge', 'quality']
        df = pd.read_table(self.streamflow_filename, names=keys, delim_whitespace=True)
        time = self._get_utc_time_from_daily_camels_streamgauge(df.Year, df.Month, df.Day)
        df['time'] = time
        df.discharge.values[df.discharge.values == -999] = np.nan
        df.discharge = df.discharge * 0.0283168466  # feet3/s to m3/s
        #df.discharge[df.discharge == -999] = np.nan  # set missing values to nan
        return df

    def _get_utc_time_from_daily_camels_met(self, datestr_lst):
        utc = sts.Calendar()
        time = [utc.time(*[int(i) for i in date.split(' ')]).seconds for date in datestr_lst]
        return np.array(time) - 12*3600 # shift by 12 hours TODO: working nicer?

    def _get_utc_time_from_daily_camels_streamgauge(self, year, month, day):
        utc = sts.Calendar()
        time = [utc.time(int(y), int(m), int(d)).seconds for y,m,d in zip(year, month, day)]
        return np.array(time)
data = TestData()
time_vec = sts.UtcTimeVector(data.time)
time_end = time_vec[-1] + 60*60*24
ta = sts.TimeAxisByPoints(time_vec, t_end=time_end)
station_info, df = data._get_met_data_from_camels_database()
Radiation runner helper:
import shyft.hydrology as api
import shyft.time_series as sts
from matplotlib import pyplot as plt
#import seaborn as sns

class RadiationRunner():
    def __init__(self):
        self.runner= True


    def run_radiation_ta(self, ta, latitude_deg, slope_deg, aspect_deg, elevation, albedo, turbidity, temperature, rhumidity,
                    flag='instant', rsm=0.0, method='dingman'):

        """Runs radiation model based on the info coming from camels data, with 24 hours timestep """
        # single method test

        # here I will try to reproduce the Fig.1b from Allen2006 (reference)

        # converting station data
        tempP1 = temperature  # [degC], real data should be used
        rhP1 = rhumidity  # [%], real data should be used
        #     rsm = 0.0

        radparam = api.RadiationParameter(albedo, turbidity)
        radcal = api.RadiationCalculator(radparam)
        radres = api.RadiationResponse()

        rv_rso = []  # clear-sky radiation, result vector
        rv_rs = []  # translated, result vector
        rv_ra = []  # extraterrestrial radiation, result vector
        rv_net = []  # net radiation
        rv_net_sw = []  # net short-wave
        rv_net_lw = []  # net long-wave

        # running 24-h timestep
        dayi = 0
        doy = api.DoubleVector()

        # running 24-h timestep
        step = sts.deltahours(24)
        n = ta.size()
        k = 1
        while (k < n):
            time1 = ta.time(k - 1)
            if method == 'dingman':
                radcal.net_radiation_step(radres, latitude_deg, time1, step, slope_deg, aspect_deg,
                                                tempP1[k], rhP1[k], elevation, rsm[k])
            else:
                radcal.net_radiation_step_asce_st(radres, latitude_deg, time1, step, slope_deg, aspect_deg,
                                                        tempP1[k], rhP1[k], elevation, rsm[k])
            rv_rso.append(radres.sw_t)
            rv_rs.append(radres.sw_cs_p)
            rv_ra.append(radres.ra)
            rv_net.append(radres.net)
            rv_net_sw.append(radres.net_sw)
            rv_net_lw.append(radres.net_lw)
            # print(radres_24h.ra)
            doy.append(dayi)
            k += 1
            dayi += 1
            # doy.append(dayi)

        return doy, rv_ra, rv_rs, rv_rso,rv_net_sw, rv_net_lw, rv_net

    def run_radiation(self, t_start, n, latitude_deg, slope_deg, aspect_deg, elevation, albedo, turbidity, temperature, rhumidity,
                    flag='instant', rsm=0.0, method='dingman'):

        """Module creates shyft radiation model with different timesteps and run it for a defined period of time (1 year with 24-hours averaging) """
        # single method test

        # here I will try to reproduce the Fig.1b from Allen2006 (reference)

        # converting station data
        tempP1 = temperature  # [degC], real data should be used
        rhP1 = rhumidity  # [%], real data should be used
        #     rsm = 0.0

        radparam = api.RadiationParameter(albedo, turbidity)
        radcal_inst = api.RadiationCalculator(radparam)
        radcal_1h = api.RadiationCalculator(radparam)
        radcal_24h = api.RadiationCalculator(radparam)
        radcal_3h = api.RadiationCalculator(radparam)
        radres_inst = api.RadiationResponse()
        radres_1h = api.RadiationResponse()
        radres_24h = api.RadiationResponse()
        radres_3h = api.RadiationResponse()

        rv_rso = []  # clear-sky radiation, result vector
        rv_ra = []  # extraterrestrial radiation, result vector
        rv_net = []  # net radiation
        rv_net_sw = []  # net short-wave
        rv_net_lw = []  # net long-wave

        dayi = 0
        doy = api.DoubleVector()
        # running 24-h timestep
        step = sts.deltahours(24)
        tadays = sts.TimeAxis(t_start, step, n + 1)  # days
        k = 1
        while (k <= n):
            doy.append(dayi)
            k += 1
            dayi += 1

        if flag == '24-hour':
            dayi = 0
            doy = api.DoubleVector()

            # running 24-h timestep
            step = sts.deltahours(24)
            tadays = sts.TimeAxis(t_start, step, n + 1)  # days
            k = 1
            while (k <= n):
                time1 = tadays.time(k - 1)
                if method == 'dingman':
                    radcal_24h.net_radiation_step(radres_24h, latitude_deg, time1, step, slope_deg, aspect_deg,
                                                tempP1, rhP1, elevation, rsm)
                else:
                    radcal_24h.net_radiation_step_asce_st(radres_24h, latitude_deg, time1, step, slope_deg, aspect_deg,
                                                        tempP1, rhP1, elevation, rsm)
                rv_rso.append(radres_24h.sw_cs_p)
                rv_ra.append(radres_24h.ra)
                rv_net.append(radres_24h.net)
                rv_net_sw.append(radres_24h.net_sw)
                rv_net_lw.append(radres_24h.net_lw)
                # print(radres_24h.ra)
                doy.append(dayi)
                k += 1
                dayi += 1
            # doy.append(dayi)
        elif flag == '3-hour':

            # running 3h timestep
            step = sts.deltahours(3)
            ta3 = sts.TimeAxis(t_start, step, n * 8)  # hours, 1h timestep
            rso_3h = []  # clear-sky radiation
            ra_3h = []  # extraterrestrial radiation
            net_sw_3h = []
            net_lw_3h = []
            net_3h = []
            k = 1
            while (k < n * 8):
                time0 = ta3.time(k - 1)
                if method == 'dingman':
                    radcal_3h.net_radiation_step(radres_3h, latitude_deg, time0, step, slope_deg, aspect_deg, tempP1,
                                                rhP1, elevation, rsm)
                else:
                    radcal_3h.net_radiation_step_asce_st(radres_3h, latitude_deg, time0, step, slope_deg, aspect_deg,
                                                        tempP1, rhP1, elevation, rsm)
                rso_3h.append(radres_3h.sw_cs_p)
                ra_3h.append(radres_3h.ra)
                net_sw_3h.append(radres_3h.net_sw)
                net_lw_3h.append(radres_3h.net_lw)
                net_3h.append(radres_3h.net)
                k += 1
            rv_rso = [sum(rso_3h[i:i + 8]) for i in range(0, len(rso_3h), 8)]
            rv_ra = [sum(ra_3h[i:i + 8]) for i in range(0, len(ra_3h), 8)]
            rv_net_sw = [sum(net_sw_3h[i:i + 8]) for i in range(0, len(net_sw_3h), 8)]
            rv_net_lw = [sum(net_lw_3h[i:i + 8]) / 8 for i in range(0, len(net_lw_3h), 8)]
            rv_net = [sum(net_3h[i:i + 8]) for i in range(0, len(net_3h), 8)]
        elif flag == '1-hour':
            # runing 1h timestep
            step = sts.deltahours(1)
            ta = sts.TimeAxis(t_start, step, n * 24)  # hours, 1h timestep
            rso_1h = []
            ra_1h = []
            net_sw_1h = []
            net_lw_1h = []
            net_1h = []
            k = 1
            while (k < n * 24):
                time1 = ta.time(k - 1)
                if method == 'dingman':
                    radcal_1h.net_radiation_step(radres_1h, latitude_deg, time1, step, slope_deg, aspect_deg,
                                                tempP1, rhP1, elevation, rsm)
                else:
                    radcal_1h.net_radiation_step_asce_st(radres_1h, latitude_deg, time1, step, slope_deg, aspect_deg,
                                                        tempP1, rhP1, elevation, rsm)
                rso_1h.append(radres_1h.sw_cs_p)
                ra_1h.append(radres_1h.ra)
                net_sw_1h.append(radres_1h.net_sw)
                net_lw_1h.append(radres_1h.net_lw)
                net_1h.append(radres_1h.net)
                k += 1
            rv_rso = [sum(rso_1h[i:i + 24]) for i in range(0, len(rso_1h), 24)]
            rv_ra = [sum(ra_1h[i:i + 24]) for i in range(0, len(ra_1h), 24)]
            rv_net_sw = [sum(net_sw_1h[i:i + 24]) for i in range(0, len(net_sw_1h), 24)]
            rv_net_lw = [sum(net_lw_1h[i:i + 24]) / 24 for i in range(0, len(net_lw_1h), 24)]
            rv_net = [sum(net_1h[i:i + 24]) for i in range(0, len(net_1h), 24)]
        elif flag == 'instant':
            # running instantaneous with dmin timstep
            minutes = 60
            dmin = 1
            step = sts.deltaminutes(dmin)
            tamin = sts.TimeAxis(t_start, step, n * 24 * minutes)
            rso_inst = []
            ra_inst = []
            net_sw_inst = []
            net_lw_inst = []
            net_inst = []
            doy1 = []
            k = 0
            while (k < n * 24 * minutes):
                timemin = tamin.time(k)
                radcal_inst.net_radiation_inst(radres_inst, latitude_deg, timemin, slope_deg, aspect_deg, tempP1, rhP1,
                                        elevation, rsm)
                rso_inst.append(radres_inst.sw_cs_p)
                ra_inst.append(radres_inst.ra)
                net_sw_inst.append(radres_inst.net_sw)
                net_lw_inst.append(radres_inst.net_lw)
                net_inst.append(radres_inst.net)
                doy1.append(k)
                k += 1
            rv_rso = [sum(rso_inst[i:i + 24 * minutes]) / (24 * minutes) for i in range(0, len(rso_inst), 24 * minutes)]
            rv_ra = [sum(ra_inst[i:i + 24 * minutes]) / (24 * minutes) for i in range(0, len(ra_inst), 24 * minutes)]
            rv_net_sw = [sum(net_sw_inst[i:i + 24 * minutes]) / (24 * minutes) for i in
                        range(0, len(net_sw_inst), 24 * minutes)]
            rv_net_lw = [sum(net_lw_inst[i:i + 24 * minutes]) / (24 * minutes) for i in
                        range(0, len(net_lw_inst), 24 * minutes)]
            rv_net = [sum(net_inst[i:i + 24 * minutes]) / (24 * minutes) for i in range(0, len(net_inst), 24 * minutes)]
        else:
            return 'Nothing todo. Please, specify timestep'

        return doy, rv_ra, rv_rso, rv_net_sw, rv_net_lw, rv_net
# Radiation runner helps to run and plot radiaiton routine results
runner = RadiationRunner()
def plot_results(xvar, yvar, fig1, ax1, ymax, xname, yname, plotname, lab, col, labloc, ymin=0.0):
    """ Plots things"""
    ax1.plot(xvar, yvar, col, label=lab)
    ax1.set_ylabel(yname)
    ax1.set_xlabel(xname)
    plt.title(plotname)
    plt.legend(loc=labloc, bbox_to_anchor=(1,0.5))
    plt.axis([0, 365, ymin, int(ymax * 1.01)])
    plt.grid(True)
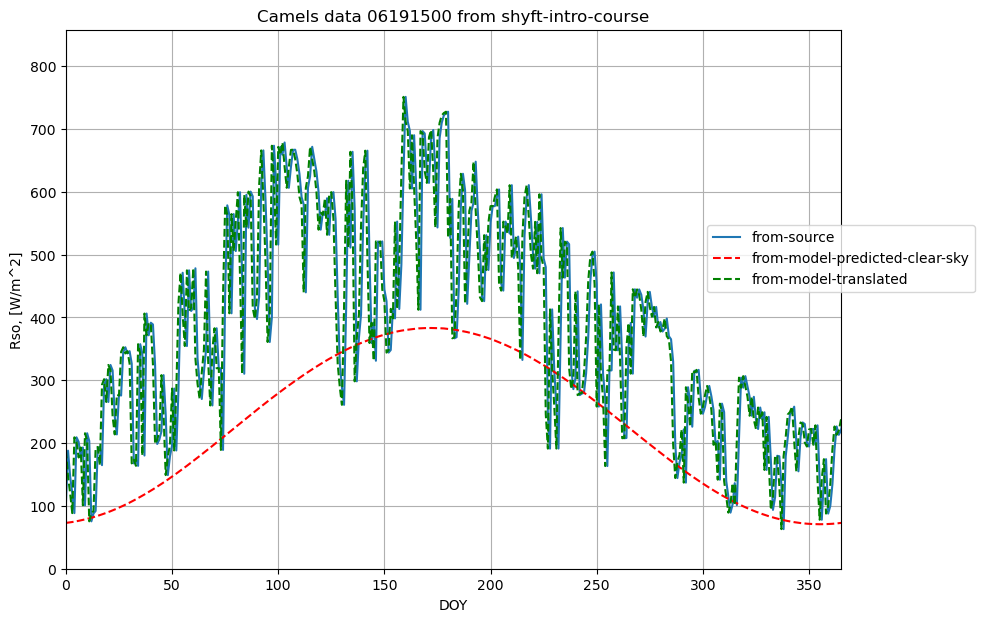
# This is result of calculation from pure camels data, assuming that radiation is measured on horizontal surface
#
latitude_deg = station_info['lat']
slope_deg = 0.0
aspect_deg = 0.0
elevation= station_info['z']
albedo = 0.5
turbidity = 0.5
ymax = 850
yname = 'Rso, [W/m^2]'
xname = 'DOY'
plotname = "Camels data 06191500 from shyft-intro-course"
labels = ('Ra','Rso')
colors = ('r--','r', 'b--','b','g--','g','k--','k','m--','m')
labloc = ("upper left","lower center", "upper center","center left")

#sns.set(font_scale=1.8)
fig1, ax1 = plt.subplots(figsize=(10, 7))

result = runner.run_radiation_ta(ta,latitude_deg, slope_deg, aspect_deg, elevation, albedo, turbidity, data.temperature, data.relative_humidity, '24-hour', data.radiation)
ax1.plot(data.radiation, label='from-source')
plot_results(result[0], result[2], fig1, ax1, ymax, xname, yname, plotname, 'from-model-predicted-clear-sky', colors[0],labloc[1])
plot_results(result[0], result[3], fig1, ax1, ymax, xname, yname, plotname, 'from-model-translated', colors[4],labloc[1])
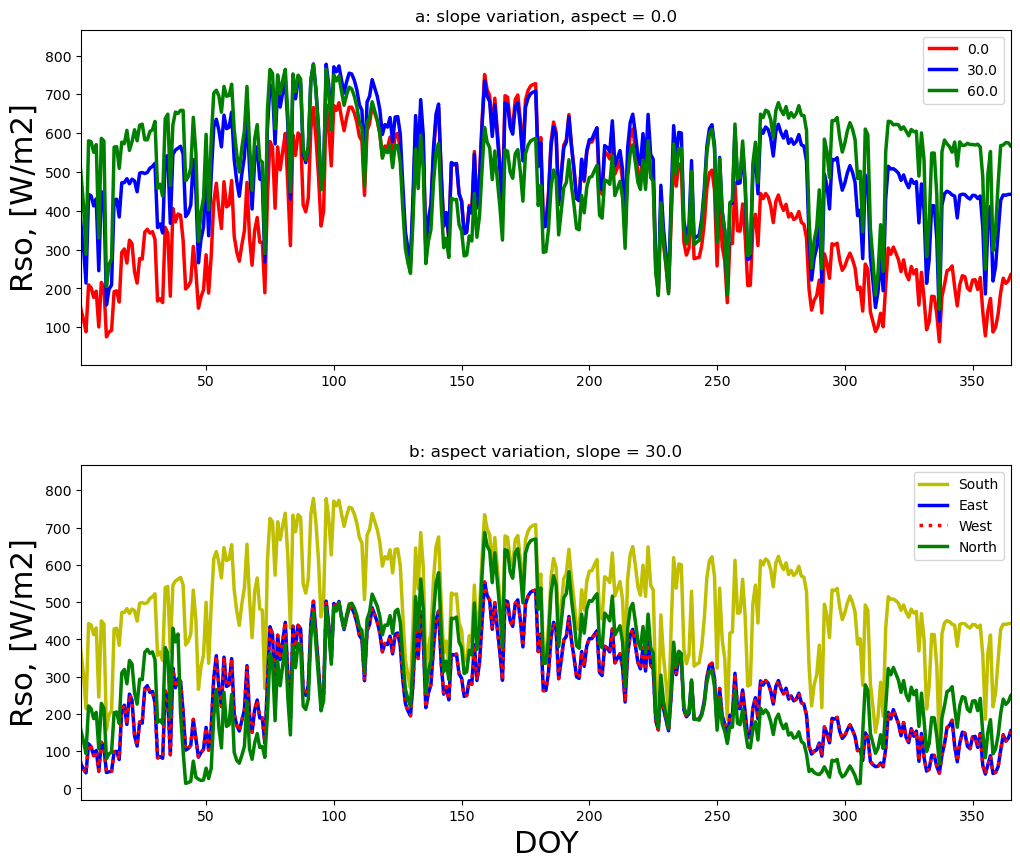
eq.38 reaction on topography
Here we can see how the eq.38 actually reacts on topography and other input changes.
#### The other notebook (radiation_sensitivity) shows only clear-sky radiation behavior
# Now lets play around with aspect, slope, albedo, turbidity
fig1, ax1 = plt.subplots(figsize=(7, 5))
slope_array = [0.0, 30.0, 45.0, 60.0, 75.0, 90.0, 110, 180, 190]
aspect_deg = 0.0
plotname = "Camels data 06191500 slope variation"
i = 0
for slope_deg in slope_array:
    result = runner.run_radiation_ta(ta,latitude_deg, slope_deg, aspect_deg, elevation, albedo, turbidity, data.temperature, data.relative_humidity, '24-hour', data.radiation)
    plot_results(result[0], result[3], fig1, ax1, ymax, xname, yname, plotname, str(slope_deg), colors[i],labloc[3])
    i+=1
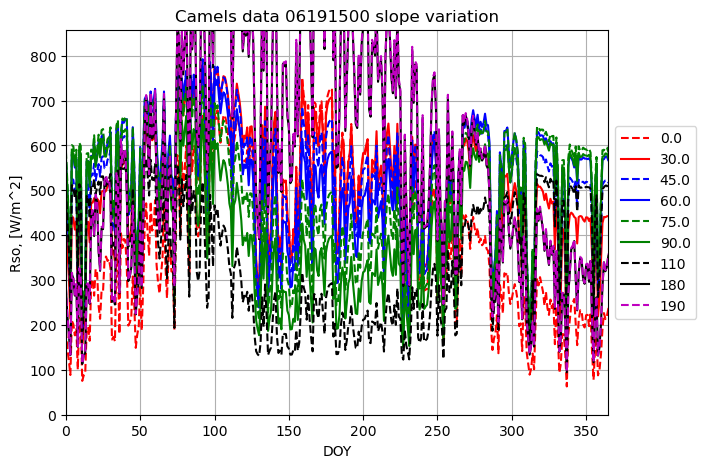
fig1, ax1 = plt.subplots(figsize=(7, 5))
aspect_array = [0.0, 30.0, 45.0, 60.0, 75.0, 90.0, 110, 180, 190]
slope_deg = 30.0 # if slope is 0 no aspect impact could be seen
i = 0
plotname = "Camels data 06191500 aspect variation"
for aspect_deg in aspect_array:
    result = runner.run_radiation_ta(ta,latitude_deg, slope_deg, aspect_deg, elevation, albedo, turbidity, data.temperature, data.relative_humidity, '24-hour', data.radiation)
    plot_results(result[0], result[3], fig1, ax1, ymax, xname, yname, plotname, str(aspect_deg), colors[i],labloc[3])
    i+=1
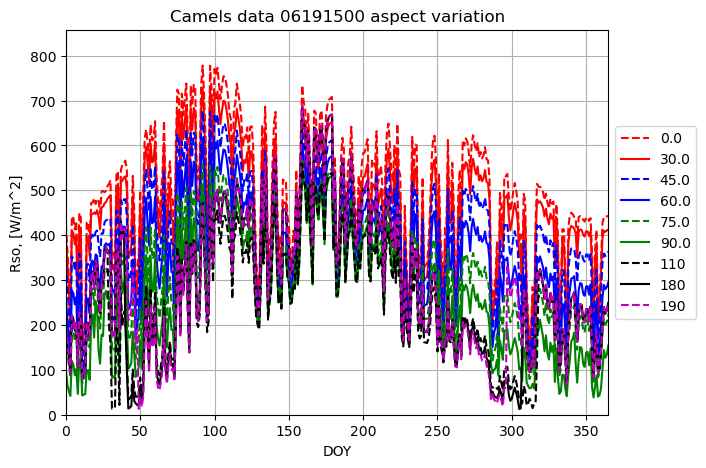
fig1, ax1 = plt.subplots(figsize=(7, 5))
lat_array = [0.0, 30.0, 45.0, 60.0, 75.0, 90.0]
slope_deg = 30.0 # if slope is 0 no aspect impact could be seen
aspect_deg = 30.0
i = 0
plotname = "Camels data 06191500 latitude variation"
for latitude_deg in lat_array:
    result = runner.run_radiation_ta(ta,latitude_deg, slope_deg, aspect_deg, elevation, albedo, turbidity, data.temperature, data.relative_humidity, '24-hour', data.radiation)
    plot_results(result[0], result[2], fig1, ax1, ymax, xname, yname, plotname, str(latitude_deg), colors[i],labloc[3])
    i+=1
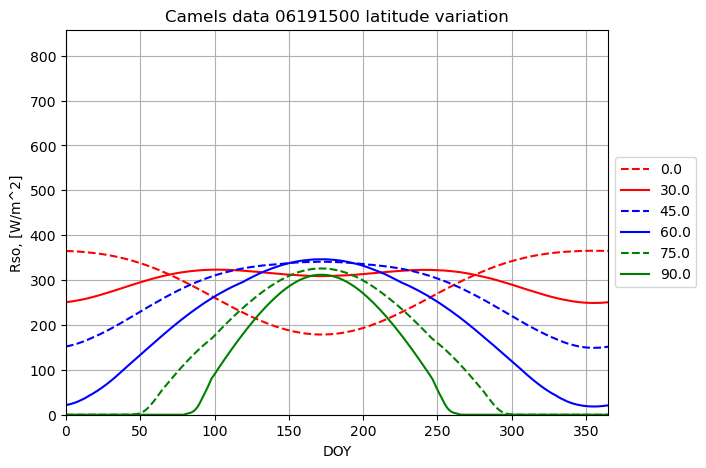
The rest shows very minor impact on the translated radiation which is kind of expected, as the measured radiation is considered a main source of information. See the radition-sensitivity notebook for impact on theoretical values.
fig1, ax1 = plt.subplots(figsize=(7, 5))
albedo_array = [0.01, 0.05, 0.1, 0.25, 0.5, 0.99]
slope_deg = 30.0 # if slope is 0 no aspect impact could be seen
aspect_deg = 30.0
latitude_deg = station_info['lat']
i = 0
plotname = "Camels data 06191500 albedo variation"
for albedo in albedo_array:
    result = runner.run_radiation_ta(ta,latitude_deg, slope_deg, aspect_deg, elevation, albedo, turbidity, data.temperature, data.relative_humidity, '24-hour', data.radiation)
    plot_results(result[0], result[2], fig1, ax1, ymax, xname, yname, plotname, str(albedo), colors[i],labloc[3])
    i+=1
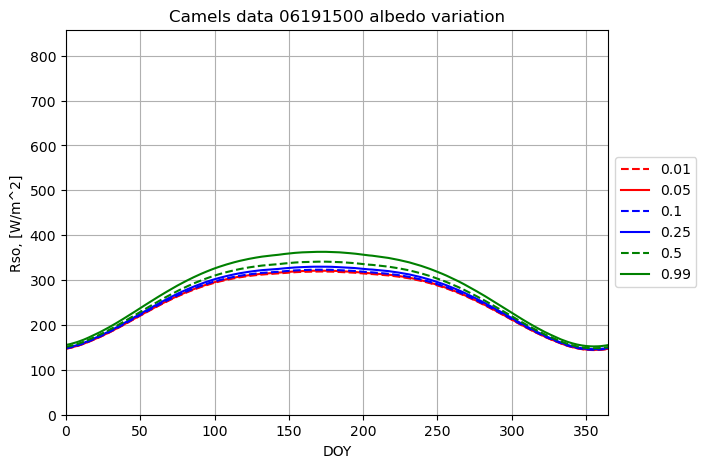
fig1, ax1 = plt.subplots(figsize=(7, 5))
turbidity_array = [0.01, 0.05, 0.1, 0.25, 0.5, 1.0]
slope_deg = 0.0 # if slope is 0 no aspect impact could be seen
aspect_deg = 0.0
albedo = 0.5
latitude_deg = station_info['lat']
i = 0
plotname = "Camels data 06191500 turbidity variation"
for turbidity in turbidity_array:
    result = runner.run_radiation_ta(ta,latitude_deg, slope_deg, aspect_deg, elevation, albedo, turbidity, data.temperature, data.relative_humidity, '24-hour', data.radiation)
    plot_results(result[0], result[2], fig1, ax1, ymax, xname, yname, plotname, str(turbidity), colors[i],labloc[3])
    i+=1
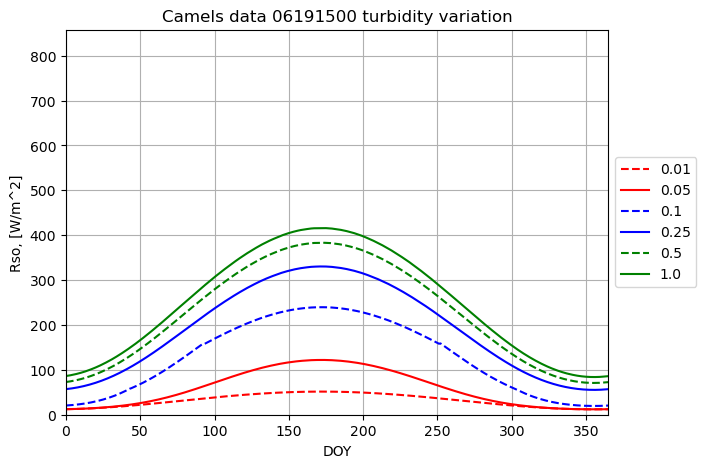
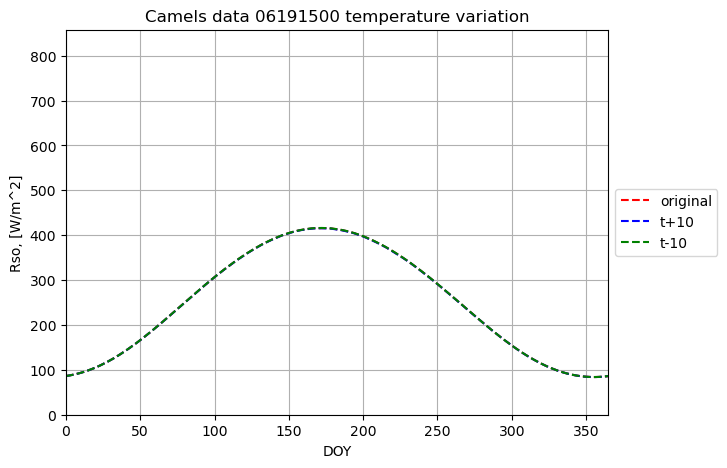
fig1, ax1 = plt.subplots(figsize=(7, 5))
turbidity_array = 0.5
slope_deg = 0.0 # if slope is 0 no aspect impact could be seen
aspect_deg = 0.0
albedo = 0.5
temp_plus10 = np.array([c+10 for c in data.temperature])
temp_minus10 = np.array([c-10 for c in data.temperature])
latitude_deg = station_info['lat']
i = 0
plotname = "Camels data 06191500 temperature variation"
result = runner.run_radiation_ta(ta,latitude_deg, slope_deg, aspect_deg, elevation, albedo, turbidity, data.temperature, data.relative_humidity, '24-hour', data.radiation)
result1 = runner.run_radiation_ta(ta,latitude_deg, slope_deg, aspect_deg, elevation, albedo, turbidity, temp_plus10, data.relative_humidity, '24-hour', data.radiation)
result2 = runner.run_radiation_ta(ta,latitude_deg, slope_deg, aspect_deg, elevation, albedo, turbidity, temp_minus10, data.relative_humidity, '24-hour', data.radiation)

plot_results(result[0], result[2], fig1, ax1, ymax, xname, yname, plotname, 'original', colors[0],labloc[3])
plot_results(result1[0], result1[2], fig1, ax1, ymax, xname, yname, plotname, 't+10', colors[2],labloc[3])
plot_results(result2[0], result2[2], fig1, ax1, ymax, xname, yname, plotname, 't-10', colors[4],labloc[3])
#sns.set(font_scale=1.8)
fig = plt.figure(figsize=(12, 10))
# plt.title('Station 06191500 of Camels data, year 1980')
from matplotlib import gridspec
gs = gridspec.GridSpec(nrows=2,
                    ncols=1,
                    figure=fig,
                    width_ratios=[1],
                    height_ratios=[1,1],
                    wspace= 0.5,
                    hspace=0.3)

ax1 = fig.add_subplot(gs[0,0])
ax1.set_ylabel('Rso, [W/m2]',fontsize=22)
ax1.set_title('a: slope variation, aspect = 0.0')
ax1.set_xlim([1, 365])
ax2 = fig.add_subplot(gs[1,0])
ax2.set_ylabel('Rso, [W/m2]',fontsize=22)
ax2.set_title('b: aspect variation, slope = 30.0')
ax2.set_xlabel('DOY',fontsize=22)
ax2.set_xlim([1, 365])
colors = ('--r','r', '--b','b','--g','g','--k','k','--m','m')
lines = ('-','--')
slope_array = [0.0, 30.0, 45.0, 60.0, 75.0, 90.0, 110, 180, 190]
aspect_deg = 0.0
plotname = "Camels data 06191500 slope variation"
i = 0
ymin = 0.0
ymax = 800.0
slope_deg = 0.0
result = runner.run_radiation_ta(ta,latitude_deg, slope_deg, aspect_deg, elevation, albedo, turbidity, data.temperature, data.relative_humidity, '24-hour', data.radiation)
ax1.plot(result[0], result[3],color=colors[1],lw=2.5,label=str(slope_deg))
slope_deg = 30.0
result = runner.run_radiation_ta(ta,latitude_deg, slope_deg, aspect_deg, elevation, albedo, turbidity, data.temperature, data.relative_humidity, '24-hour', data.radiation)
ax1.plot(result[0], result[3],color=colors[3],lw=2.5,label=str(slope_deg))
slope_deg = 60.0
result = runner.run_radiation_ta(ta,latitude_deg, slope_deg, aspect_deg, elevation, albedo, turbidity, data.temperature, data.relative_humidity, '24-hour', data.radiation)
ax1.plot(result[0], result[3],color=colors[5],lw=2.5,label=str(slope_deg))
ax1.legend()
# lines = []
# labels_slope=[str(c) for c in slope_array]
# for slope_deg in slope_array:
#     result = runner.run_radiation_ta(ta,latitude_deg, slope_deg, aspect_deg, elevation, albedo, turbidity, data.temperature, data.relative_humidity, '24-hour', data.radiation)
#     radplt = ax1.plot(result[0], result[2],label=str(slope_deg))
#     lines+=radplt
#     # fig.legend(loc=labloc, bbox_to_anchor=(1,0.5))
#
#     i+=1 #
# labels= [l.get_labels() for l in lines]
# handles, labels = ax1.get_legend_handles_labels()
# ax1.legend(handles, labels)

slope_deg = 30.0
aspect_deg = 0.0
result = runner.run_radiation_ta(ta,latitude_deg, slope_deg, aspect_deg, elevation, albedo, turbidity, data.temperature, data.relative_humidity, '24-hour', data.radiation)
ax2.plot(result[0], result[3],'y',lw=2.5,label='South')
aspect_deg = -90.0
result = runner.run_radiation_ta(ta,latitude_deg, slope_deg, aspect_deg, elevation, albedo, turbidity, data.temperature, data.relative_humidity, '24-hour', data.radiation)
ax2.plot(result[0], result[3],colors[3],lw=2.5,label='East')
aspect_deg = 90.0
result = runner.run_radiation_ta(ta,latitude_deg, slope_deg, aspect_deg, elevation, albedo, turbidity, data.temperature, data.relative_humidity, '24-hour', data.radiation)
ax2.plot(result[0], result[3],c='r',lw=2.5,ls=':',label='West')
aspect_deg = 180.0
result = runner.run_radiation_ta(ta,latitude_deg, slope_deg, aspect_deg, elevation, albedo, turbidity, data.temperature, data.relative_humidity, '24-hour', data.radiation)
ax2.plot(result[0], result[3],colors[5],lw=2.5,label='North')
ax2.legend()

# aspect_array = [0.0, 30.0, 45.0, 60.0, 75.0, 90.0, 110, 180, 190]
# for aspect_deg in aspect_array:
#     result = runner.run_radiation_ta(ta,latitude_deg, slope_deg, aspect_deg, elevation, albedo, turbidity, data.temperature, data.relative_humidity, '24-hour', data.radiation)
#     ax2.plot(result[0], result[2],label=str(aspect_deg))
#     # ax2.legend(loc=labloc, bbox_to_anchor=(1,0.5))
#     i+=1
fig.show()